-
Who are the close game win specialists?
I think one of the signs of a good team is their ability to regularly convert close games into wins. I’ve chosen to define a close game as one where going into the 3rd period, teams are level or there is a one goal difference. This definition does exclude remarkable comebacks, for example if you’re 3 down going into the third and convert that to a win, then that is often a sign of battling spirit. But if could also signal a complete collapse by the opponent or a slew of penalties. It’s also less common, so the ability to see out a close game is I feel, more telling…
-
Stats and reality
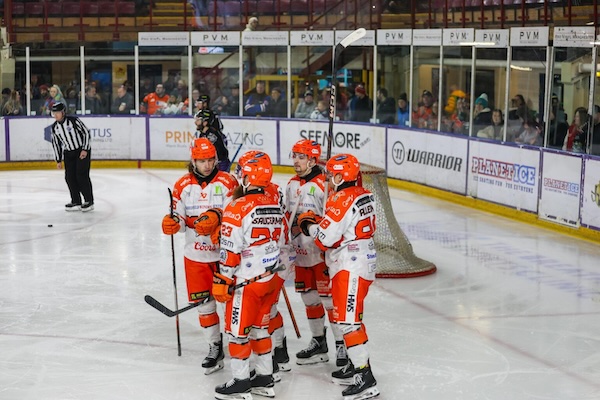
Often the data from a game reveals the narrative that played out. But also, quite often it doesn’t. For instamce, without seeing the game, Sheffield’s away win in Glasgow on the 17th Jan, would suggest a Clan win if anything. They had almost double the number of total shots (63 vs 35), more shots on target (36 vs 24), and a higher number of expected goals (2.49 vs 1.44). And yet Sheffield won 3-1, with all their goals coming in the first period. I’m sure there is a reason for that – bad netminding, lucky bounces, carefully crafted shots, etc. But from the raw stats alone you wouldn’t get that…
-
Mid-season review – Guildford, Manchester, Nottingham, and Sheffield
Concluding the mid-season review posts, let’s take a look at the remaining four teams. Guildford Flames Guildford had an inconsistent season last year, ending with a poor 44% win ratio, which given that they challenged for the title the previous season was surprising. This year they’re not back to that 22-23 form, but they have improved on 23-24 with a win percentage of 55.56% for the first half of the season. One might expect an improvement across all stats, but really the only one of note is Goals For, where they are scoring 3.3 goals per game vs 2.96. Elsewhere the stats are similar if not slightly worse, for example…
-
Mid-season review pt 2 – Dundee, Fife and Glasgow
Continuing on from the previous post, let’s take a look at the next three teams alphabetically, which also happens to capture the Scottish contingent. Dundee Stars Dundee’s win percentage is down on last year (33% vs 41%), and they are conceding more on average (4.15 vs 3.65), but their form overall is picking up. In other areas they operate just below the league average usually. One area of concern is that they give up the second highest (after Fife of course) number of medium chances against. Medium chances correlate highly with overall wins, so this suggests getting penned back too much, but I’ll come to that in a moment. Their…
-
Mid season review
Now that all teams have played at least 27 games, we can do a mid-season review. Unlike the quarter season review, there are enough games played now to make the data more meaningful. I’ll do this on a team-by-team basis, and to allow a reasonable dive into each one, split it across a few posts. To allow for fair comparison, I’m basing this on the first 27 games, even if a team has played more (so my stats may differ from the EIHL ones for each team). Let’s go in alphabetical order and start with the Giants. Belfast Giants We’ll start each review by a comparison with stats from the…
-
Looking at the Devils dip
I’m a Devils fan, so apologies for the bias in looking at them in this post, but there are aspects that are applicable across all teams. The Devils have been in a poor run of form recently, winning only 4 of their last 8 games, compared with 10 wins from the preceding 12. So their win percentage has dropped from 83% to 50%. The former is potential league winning percentage, and the latter is mid-table form. Nearly all teams have a dip at some point in the season, so it’s not necessarily that anything has changed, but what’s interesting with the Devils is that there was a definite moment you…
-
Shot creation
Each gamesheet the EIHL provides gives us a tally of the High, Medium and Low danger shots, based on where those shots took place. Obviously you want to create lots of high danger shots and not give up many. A high danger shot would be something like a player in the slot with a clear sight of goal, an odd man rush, etc. So, let’s take a look at how meaningful these figures are. To take an example of when they are not very meaningful, look at Cardiff’s 6-0 away win at Manchester. They must have created a lot of high danger chances, right? Nope, zero recorded. Okay then, they…
-
Quarter season check-in
As all teams have no played a minimum of 13 league games, we can have a look at how they are faring across various stats. I’m taking the first 13 games for each team here, which means of course that some teams will have played tougher opponents more often than others, but it’s a reasonable snapshot. I looked at netminder stats in the last post so I won’t cover any of them here, as they haven’t changed much, although with the Devils having both netties injured, that might soon impact on their previously impressive numbers. First up, let’s look at some shot related statistics. Corsi is the number of all…
-
How are EIHL goalies performing so far?
Now that we nearly have 10 games for all teams, we can start to have some feel for performance. Let’s see how the goalies have been performing so far. There are a number of stats we can use for this. The first, most obvious, is Save Percentage, ie how many shots they faced did they save, as a percent. Carruth leads this with 98.21% and Bowns is 2nd on 94.06, making happy stats for Devils fans. But is that a fair stat to use? It can be influenced by how many shots they have faced. If your defence is doing a sterling job of stopping any shots getting to you,…
-
Gauging offences & defences so far
How are teams performing offensively and defensively from an analytics perspective? There are several ways you could look at this – the average number of goals scored and conceded (or just the difference between the two) would be one simple measure. So with the usual caveats that we are a) too early in the season to have meaningful data yet and b) teams have not played an equal number of games, let’s do that to start with. This gives us the following ranking, considering league games only: Shef 2.333333333 Cov 1.75 Car 1.555555556 Gui 1 Not 0.5 Bel 0 Man -0.75 Dun -1.125 Fif -2.333333333 Gla -2.444444444 Average goal difference…