How are EIHL goalies performing so far?
Now that we nearly have 10 games for all teams, we can start to have some feel for performance. Let’s see how the goalies have been performing so far. There are a number of stats we can use for this. The first, most obvious, is Save Percentage, ie how many shots they faced did they save, as a percent. Carruth leads this with 98.21% and Bowns is 2nd on 94.06, making happy stats for Devils fans. But is that a fair stat to use? It can be influenced by how many shots they have faced. If your defence is doing a sterling job of stopping any shots getting to you, then that’s fewer saves you have to make.
So, to allow for this we can use Goals Saved Above Average (GSAA). This compares any particular netminder against the league average. So we take the number of shots faced and multiple it by the league average, to tell us how many saves the average goalie would make. We subtract this from the shots faced to give us the number of goals the average goalie would concede and then from this subtract the actual number of goals a particular nettie has let in. Let’s take an example: Carruth has faced 56 shots and conceded one goal. The average save percentage (divided by 100) across the league is 0.8966. So the average goalie would have saved 56 * 0.8966 = 50.21 shots. This means they would have conceded 5.79 goals (56-50.21). Carruth has only conceded 1, which means he has saved 4.79 goals compared against the average goalie. Bowns leads this stat with a whopping 14.08 (for comparison Connor Hellebuyck in the NHL has a GSAA currently of 15.06 and the next goalie to him, Lukas Dostal, has 12.07).
But this can also be tweaked as some goalies have had more ice time, and GSAA is cumulative, so you have longer to have saved, or conceded, more goals as you play more. So we can tweak it to accommodate ice time. If we divide the GSAA by the number of minutes played, and multiply that by 60, it gives us a score of how many Goals Saved Above Average per game you might expect. Carruth leads this currently with 2.87, but we might expect that to decrease as he gets more ice time.
These figures are summarised in the table below:
| Player | Save % | GSAA | GSAA/60 mins |
| Mac Carruth | 98.21 | 4.789466667 | 2.87368 |
| Ben Bowns | 94.06 | 14.08266667 | 1.46440208 |
| Rok Stojanovic | 92.86 | 0.8947333333 | 0.9255862069 |
| Jake Kupsky | 92.72 | 4.610883333 | 0.9314915825 |
| Mat Robson | 92.63 | 10.04695 | 1.004695 |
| Matthew Greenfield | 91.55 | 4.02065 | 0.5004958506 |
| Ryan Bednard | 90.65 | 2.124033333 | 0.2655041667 |
| Jackson Whistle | 90 | 0.3045 | 0.1020670391 |
| Shane Owen | 89.92 | 1.043183333 | 0.1113718861 |
| Tom McCollum | 89.33 | -0.4925 | -0.08140495868 |
| Landon Bow | 89.02 | -1.5677 | -0.2001319149 |
| Evan Weninger | 89.01 | -2.368466667 | -0.2759378641 |
| Eamon McAdam | 88.97 | -0.9398666667 | -0.1861122112 |
| Jarrett Fiske | 88.66 | -0.9718166667 | -0.3861523179 |
| Richard Sabol | 88.14 | -3.601533333 | -0.4823482143 |
| Lucas Brine | 84.85 | -3.1767 | -1.58835 |
| Janis Voris | 83.33 | -3.4173 | -2.628692308 |
| Alexander Oldale | 80 | -0.4830833333 | -1.44925 |
A further stat we can use, is Goals Saved Above Expected (GSAx). This takes into account the quality of the shots the netminder faces so is perhaps a better measure. To calculate this we take the Expected Goals Against (provided by the EIHL) and subtract the actual goals conceded. So if your opponent was expected to score 2.65 and only scored 1, then the goalie has a GSAx of 1.65 (2.65-1). Unhelpfully we don’t have this data at the level of each goalie from the EIHL, only at each game. So, I’d have to go through and work out who was playing when, and I can’t be arsed. But we can plot it for each team at least. Perhaps surprisingly the Devils here are the only team with a positive GSAx, which suggests that even teams who are winning are giving up more goals than you would expect. Fife, who are having a poor season, are only marginally worse in this respect than Belfast. The Giants score more though, which kinda helps.
It will be interesting to see if these trends change over the season. As a Devils fan, I hope not 🙂
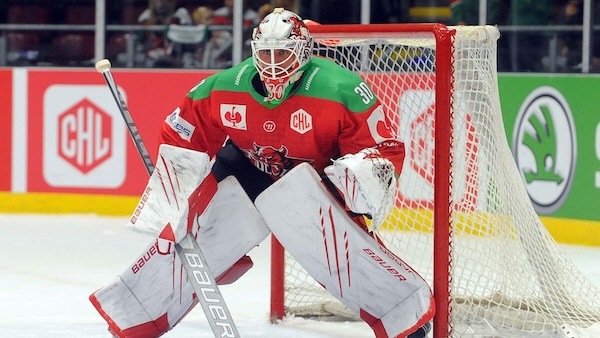
(Photo James Assinder)


2 Comments
Pingback:
Pingback: