The Value of Expected Goals
(Image from https://insidetherink.com/inside-the-stats-expected-goals/)
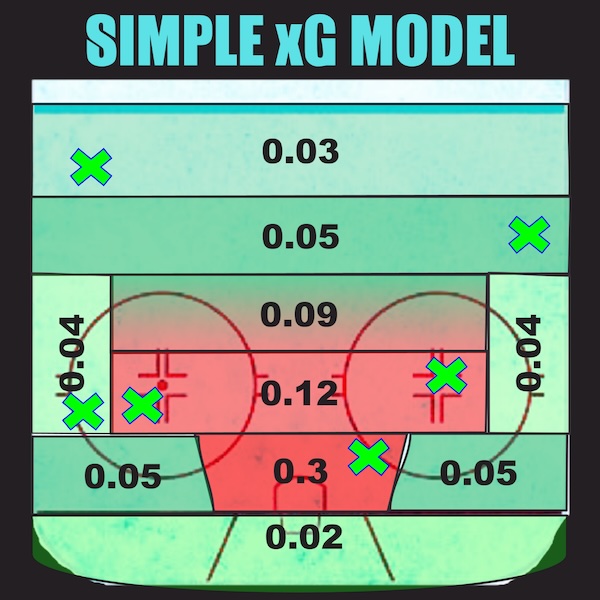
There are still a couple of games remaining in the season, but we can safely do some season analysis now. In this post I want to dig into Expected Goals (xG) and Expected Goals Against (xGA). These are defined as “a performance metric that estimates the probability of a shot resulting in a goal, based on factors like shot location, angle, and assist type”. There are different ways of calculating it, and I’m taking the figures provided by the EIHL here. It tells you how many goals your team was likely to have scored if you could replay that game a 100 times or so, thus taking out random factors.
In How to Win the Premier League, Ian Graham details his work with Liverpool, and places a lot of emphasis on Expected Goals. It is the type of thing analytic skeptics like to dismiss – you don’t win games with expected goals, it’s real goals that count, etc. But if you’re trying to develop or look at long term trends, it does tend to reveal the underlying patterns, which will likely come through over time, ignoring lucky, or unlucky streaks, which people often place too much emphasis on. Football is a low scoring game, and so Expected Goals has a strong influence. However, hockey is more high scoring, plus it has confounding variables such as the policy of pulling the netminder (often resulting in additional late goals), and overtime with shootouts, which are not normal scoring situations.
I thought I’d play with Expected Goals and Expected Goals Against and see how informative it is with regards to the EIHL. The first thing we can do is look at how teams performed against their expected goals. If we subtract Expected Goals from Actual Goals, then the higher the positive value, the better. If you actually scored 5 and were only expected to 3, then well done you. We can flip it for Expected Goals Against, so subtract the actual goals conceded from the xGA. Here any positive value is good, as you will be conceding fewer goals than expected. If we chart these averages for each team over the season then we get the following:
Guildford, Sheffield and Coventry have all scored nearly a goal a game more than might be expected. Only Nottingham have (just) managed to have a positive value for goals conceded, meaning they concede 0.06 goals less than might be expected. Every other team concedes more than they should, with Fife topping this with nearly two more goals every game. Interesting to note that Belfast don’t vary much around 0, meaning they roughly score and concede as much as you’d expect. This points to consistency and although outperforming Goals Expected might seem desirable, it is probably better for long term progression to create chances and actually convert them.
Another aspect we can examine is how this has influenced wins and losses. We can compare the actual result with whether a team was expected to win a game – ie if you subtract xGA from xG and get a positive number, then you were expected to outscore your opponents. From this we can calculate the following metrics:
- Total number of Expected Wins
- No. Wins gained from an expected Win
- No. Losses suffered from an expected Win
- No. Wins from an expected Loss
- Actual Wins as a Percentage of Expected Wins
Let’s chart the first of these, to get a feel for expected winners – how many games were teams expected to win and what percentage of those did they actually win?
I’ll confess that this came as something of a surprise. While I expected Sheffield and Belfast to lead, I wasn’t anticipating how much they were out in front. From the actual points tally, you might expect Nottingham and Cardiff to be closer. The bad news for these two teams is that it probably means they are further behind the top two than they might appreciate. Going from 29 expected wins to nearer 40 is not just a matter of avoiding injuries or bad luck, but indicates a more prolonged squad development, I would argue. Next season it is likely that either Belfast or Sheffield will be closer to their expected wins.
If we chart the next three metrics in our list, then we can see which teams were the best at converting these expected wins to actual wins and those who converted projected defeats into wins.
In pure numerical terms, Belfast and Sheffield, as you would expect convert the most expected wins in to actual wins, mainly because they have more of them to work with (we’ll look at this in the next bit). To reiterate the point I made above though, both of them lost 10 games which you would have expected them to win – they probably won’t be as generous next season. If I had to bet beforehand I would have wagered that Coventry were the best at converting expected defeats into wins and that was indeed the case with 12 such games. This has been a mark of their season. It speaks to their style of play and their spirit, but it may also not be sustainable in the longer term. Both Glasgow and Manchester’s figures speak to inconsistency, they could have won 9 more games based on their performances, but then again they were expected to lose 8 and 7 more respectively. The figures might offer some encouragement for Dundee who could have improved their lot.
The last metric is to convert those actual wins and expected wins to a percentage, to give some indication as to which teams have been under or over-performing against their expected results.
This is pretty much just a reformulation of information in the previous chart, but useful I think to have it summarised as a percentage. Coventry, Nottingham Guildford and Cardiff have all won more than might be expected. Belfast and Sheffield have only won in the 80% range of games they were expected to. Some of this is a result of absolute numbers – if you’re expected to win over 40 games then you will have more games where something won’t go your way. As your expected wins increase it is likely that the number of these that are actual wins will decrease. For Fife it remains depressing, they won 80% of the games they were expected to, so it’s not as if they have much room for improvement there.
In the next post I’ll look at how Expected Goals correlates with other factors, but that’s probably enough for now.
