24-25 season
-
Quarter season check-in
As all teams have no played a minimum of 13 league games, we can have a look at how they are faring across various stats. I’m taking the first 13 games for each team here, which means of course that some teams will have played tougher opponents more often than others, but it’s a reasonable snapshot. I looked at netminder stats in the last post so I won’t cover any of them here, as they haven’t changed much, although with the Devils having both netties injured, that might soon impact on their previously impressive numbers. First up, let’s look at some shot related statistics. Corsi is the number of all…
-
How are EIHL goalies performing so far?
Now that we nearly have 10 games for all teams, we can start to have some feel for performance. Let’s see how the goalies have been performing so far. There are a number of stats we can use for this. The first, most obvious, is Save Percentage, ie how many shots they faced did they save, as a percent. Carruth leads this with 98.21% and Bowns is 2nd on 94.06, making happy stats for Devils fans. But is that a fair stat to use? It can be influenced by how many shots they have faced. If your defence is doing a sterling job of stopping any shots getting to you,…
-
Gauging offences & defences so far
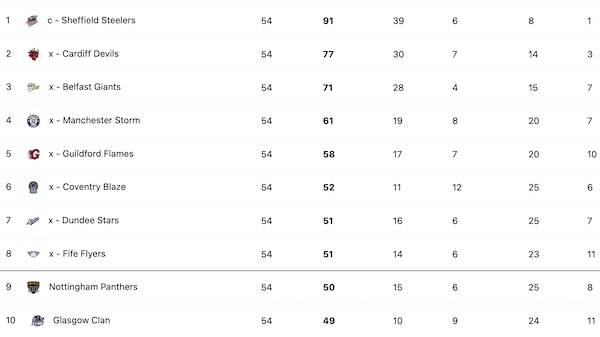
How are teams performing offensively and defensively from an analytics perspective? There are several ways you could look at this – the average number of goals scored and conceded (or just the difference between the two) would be one simple measure. So with the usual caveats that we are a) too early in the season to have meaningful data yet and b) teams have not played an equal number of games, let’s do that to start with. This gives us the following ranking, considering league games only: Shef 2.333333333 Cov 1.75 Car 1.555555556 Gui 1 Not 0.5 Bel 0 Man -0.75 Dun -1.125 Fif -2.333333333 Gla -2.444444444 Average goal difference…
-
How are teams performing compared with last season?
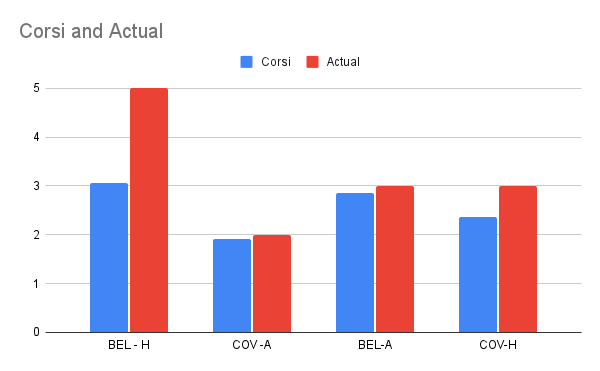
Ok, it’s very early doors, and some teams have only played five league games, but let’s have a quick look at how all of the teams are performing in the league, compared with what might be expected based on last year. To do this I have taken the number of wins each team has recorded in the league, and subtracted from this the predicted score based on last year’s match ups. As I detailed here, I’ve got two methods for calculating this. The first is just straightforwardly taking the average number of goals for and against when two teams played each other, separated out for home and away. The second…
-
Special teams bonanza – thoughts from the weekend 19th Oct
It is an accepted truth that in the NFL, special teams win games. With ball of its specialised plays, that is perhaps not surprising in American Football, but hockey is a more fluid game, so while the special units are important, they are not as significant in determining the outcome. Apart from this weekend that is. Apart from Friday’s match up between the Storm and Clan, every team that performed better on PP and PK was victorious (the Flyers and Flames drew on these, both being inefficient in their PPs). The average PP efficiency for the winning team was 45% compared with 13.5% for the losing teams. Which means that…
-
Some analytics thoughts from weekend 12th Oct 24
(Photo credit Scott Wiggins) Because the Elite League is managed with all the finesse of a drunken estate agent writing haiku, we are now in the situation where the Devils have played 7 league games while a few others have only played 2. In the meantime we’ve had 33 games in the world’s most pointless knock-out format in the Challenge Cup. Because this format is so tortuous, you can’t really draw anything from the form or data. They may as well play 2 games each in a proper elimination format and have the remainder in clown outfits. Soooo, with regards to last weekend, that means there were few games of…
-
Some analytics thoughts from weekend 5th Oct 24
Giants 3 – 1 Devils. The Devils were one up going into the third, but conceded three in that final period. I blogged before about how important that ability to win close games is (defined as ones where there is a one goal or tie going into the third). The Giants demonstrated that on Saturday. This prompted me to look back at the data from last season. I suspected that close wins might be more prevalent at home, so counted the close wins up for each team, and divided by their total number of close wins to give a percentage. We’re dealing with fairly small sample sizes here, the total…
-
Making score predictions
A group of four of us make a prediction on every Cardiff Devils home game. We used to put £1 in a pot each for every prediction, and the winner would collect the sum at that point. Given that was 4 predictions per game and you might play around 35 games with Cup and Playoffs, you would think someone would be winning regularly. That was not the case – the pot would regularly get beyond £40 and the end of the season would arrive with no winner so we would share it out. Now it’s likely that we are just bad at making predictions, but it also highlights an issue…
-
Room for improvement
Looking at the data for the EIHL 23-24 season, I thought I’d see if there were areas that the data alone suggests could be improved for each team. A couple of caveats first – this is very broad stroke data, because the EIHL don’t have an API so I had to enter it all manually, and the data won’t tell us lots of pertinent information (for example the tragedy for the Panthers). Also I’m not basing it off watching the teams (although I have watched all of them several times), just what a raw look at the data tells us. No shouting now, it’s just for fun. So working from…