Making score predictions
A group of four of us make a prediction on every Cardiff Devils home game. We used to put £1 in a pot each for every prediction, and the winner would collect the sum at that point. Given that was 4 predictions per game and you might play around 35 games with Cup and Playoffs, you would think someone would be winning regularly. That was not the case – the pot would regularly get beyond £40 and the end of the season would arrive with no winner so we would share it out. Now it’s likely that we are just bad at making predictions, but it also highlights an issue around hockey – although it is low scoring compared with sports such as basketball or baseball, there is a much wider range of possible scores than in football. Just the regular practice of pulling the netminder in the last few minutes adds a complicating factor that most sports don’t have, and on top of that you have the impact of penalties, no drawing of games and fast transitions which means scores can change quickly.
Being able to predict scores would be a fruitful business of course, but it’s part of the delight of sport, and hockey in particular that it remains so elusive. It is particularly difficult early in a season, when you have no data to go on, there are new rosters, often new coaches and new patterns to settle into. It takes about 20 games for many stats to become meaningful, which means you can’t say much with conviction before Christmas. But it’s fun to try.
How might we go about trying to predict scores early in the season? We could look at the roster of each team, and make some inference based on the stats of each player. This would account for changes in rosters. This would be complex and require weighting of existing data for particular leagues – for example is 40 points in the German 2nd league roughly equal to 40 points in the EIHL? That probably can be done, but not by me.
You can use a form of distribution model to assess the likelihood of certain scores. This paper applied models from football prediction to ice hockey and reckons you can make a profit against bookies. Even the authors admit it is complex however, but they do use historical data to predict one season, which suggests historical data has some value (I’m confused as to how they rate games as being drawn though, do they ignore OT?).
There’s a really nice model on Reddit that uses factors as form, fatigue, as well as expected goals, Corsi and matchup data. As these season develops I think I’ll incorporate some of these factors. Even with this level of analysis the author reports a 4-5% return on investment when betting.
At the other end of the complexity scale we could simply take the average goals for and against that particular opponent from last season. This doesn’t take into account new players but general historical trends might be relevant, particularly at the start of the season. It’s possible, but not very probable for instance that Fife will beat the Steelers 7-1 in Sheffield. We could tweak this a bit to separate last season’s match-ups into the home and away average goals for and against. This would refine it a bit as many teams perform better at home and some teams have a bogey ground to go to (the Devils seem to stutter up in Fife for example).
I don’t have the more advanced stats from last season, so I’m going with a mildly simplistic model, let’s call it Corsi Only. As the season progresses this season’s data can be added in and weighted more heavily as it represents the current situation with regards to rosters.
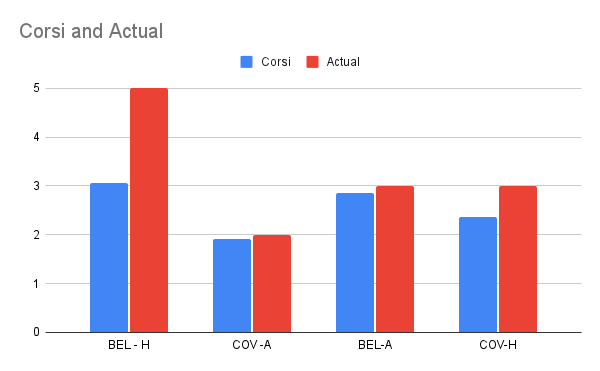
Firstly, I’ve broken down each team’s performance against the other teams (for the league games only), and home and away for each of these. This gives us goals for and against, also Corsi for and against. I have also calculated each team’s overall shot conversion rate (Goals scored/Total shots) over the whole season. From this we can calculate the expected goals a team should score against their opponent. For example, Belfast have an overall shot conversion rate of 0.064 (ie they score 6.4 times for every 100 shots of all types that they take). They had 47.7 shots on average across the 3 games at home against Coventry at home, and 33.7 shots against. Using the shot conversion of 0.064 and Coventry’s of 0.057 gives us expected goals of 3.05 and 1.91 respectively. If we do the same for away games, with their respective shots for and against we get 2.84 vs 2.35. The actual averages from last year were:
Home:
Belfast 5 – 2 Coventry
Away:
Coventry 3 – 3 Belfast
The graph below shows that the Corsi model was pretty accurate except for Belfast home goals.
I have a sense this Corsi Only view may not give sufficient weight to home advantage. That average score from last year might be a more robust predictor, but let’s see.


One Comment
Pingback: